Train tracking
Spain's commuter trains live with Renfe's open data: where each train is, when two get too close, and the line's train graph. An educational demo: not a safety system.
What it shows
- Live public data (GTFS and GTFS-Realtime)
- Custom charts: train graph and map
- A simulation when there is no connection
How it works
- 1
The train graph
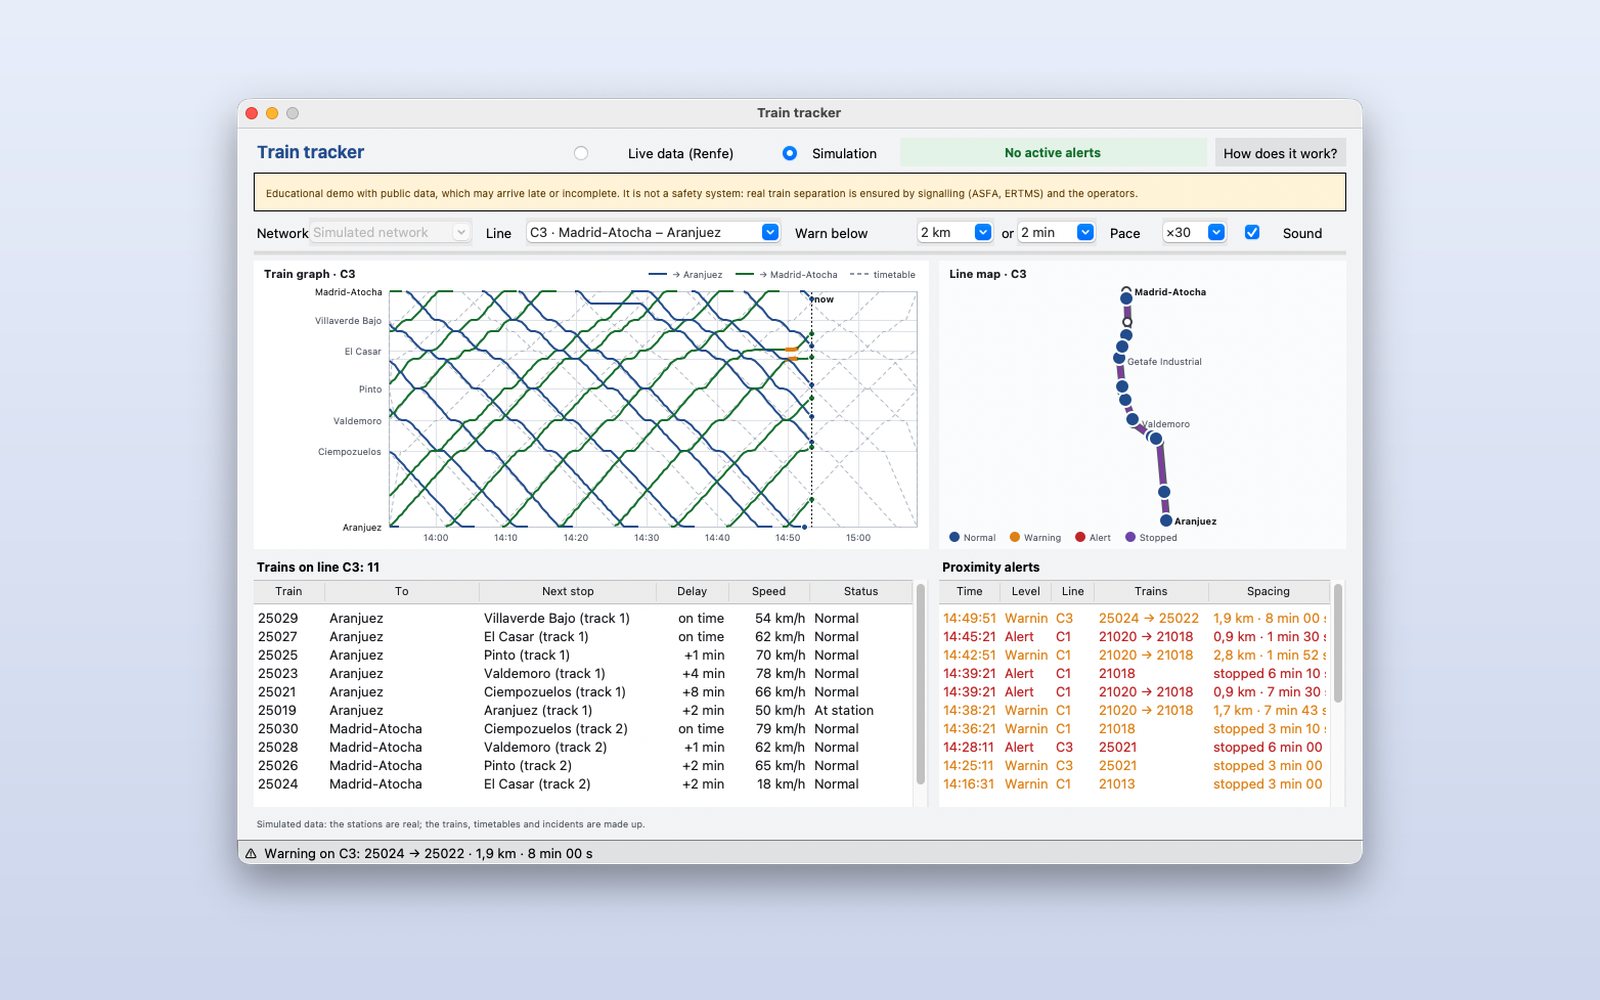
Stations vertically, time horizontally: each line is a train. Orange or red stretches are proximity warnings and alerts. This capture is the simulation, which works offline.
 2
Change line
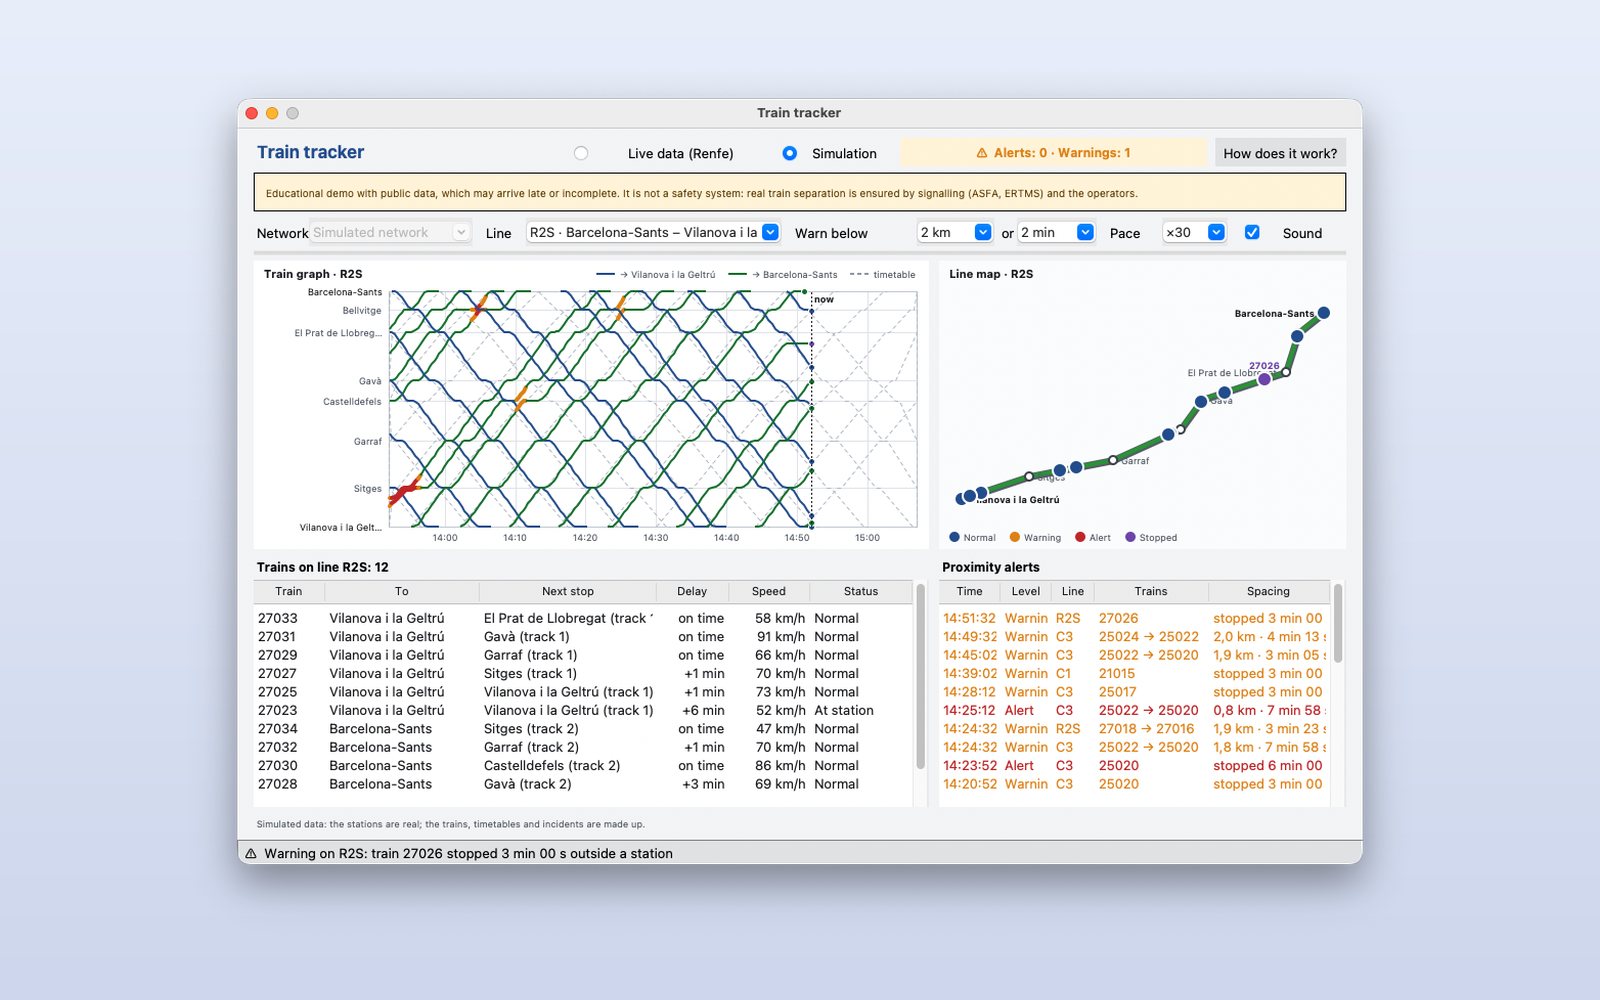
Pick the area and line; alerts are listed with time, trains, distance and the time between them. Thresholds are set at the top.
 3
Follow a train live
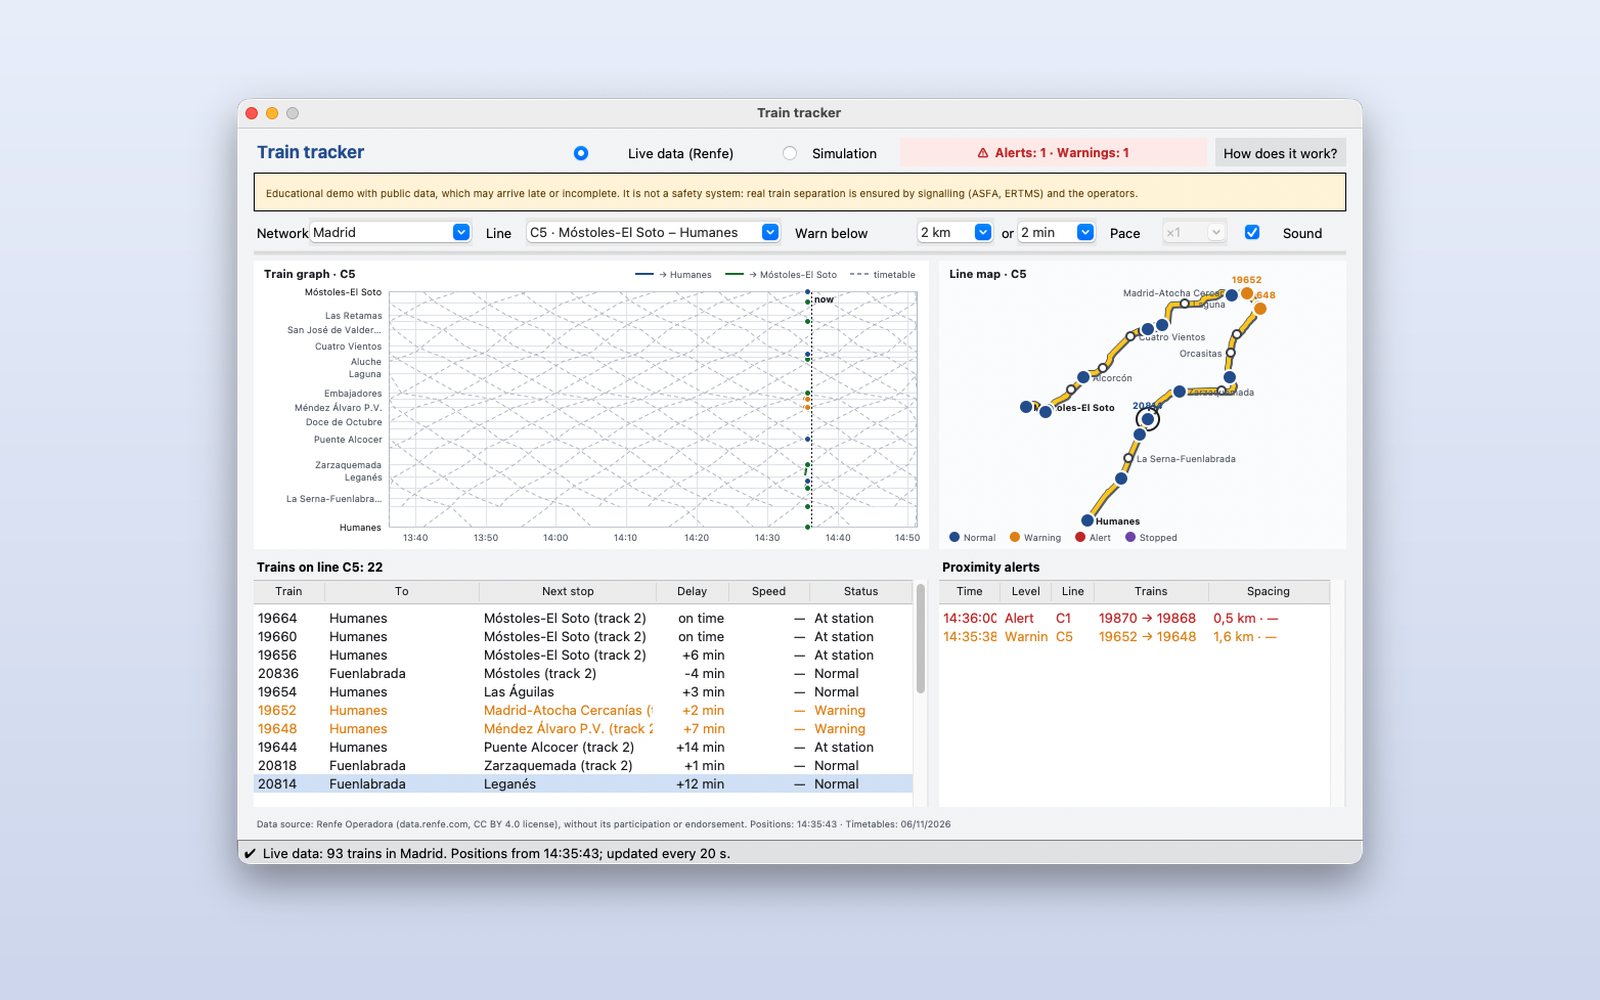
With Renfe's live data (here, dozens of trains at once), pick a train in the table or on the map to see its next stop, its real delay and its estimated speed.
This demo comes as an example in DMarlon Studio: open it in the Designer to see its design and code, change it and press Run.